Platform Overview
The MemMachine Platform Dashboard serves as your central hub for monitoring usage, accessing API Key information, and managing your account. Think of it as your console’s home screen.Usage Monitoring (Graphs)
This section displays key metrics related to your Platform activity, including API call volume, processing time, and resource consumption. You’ll see this area prominently featured: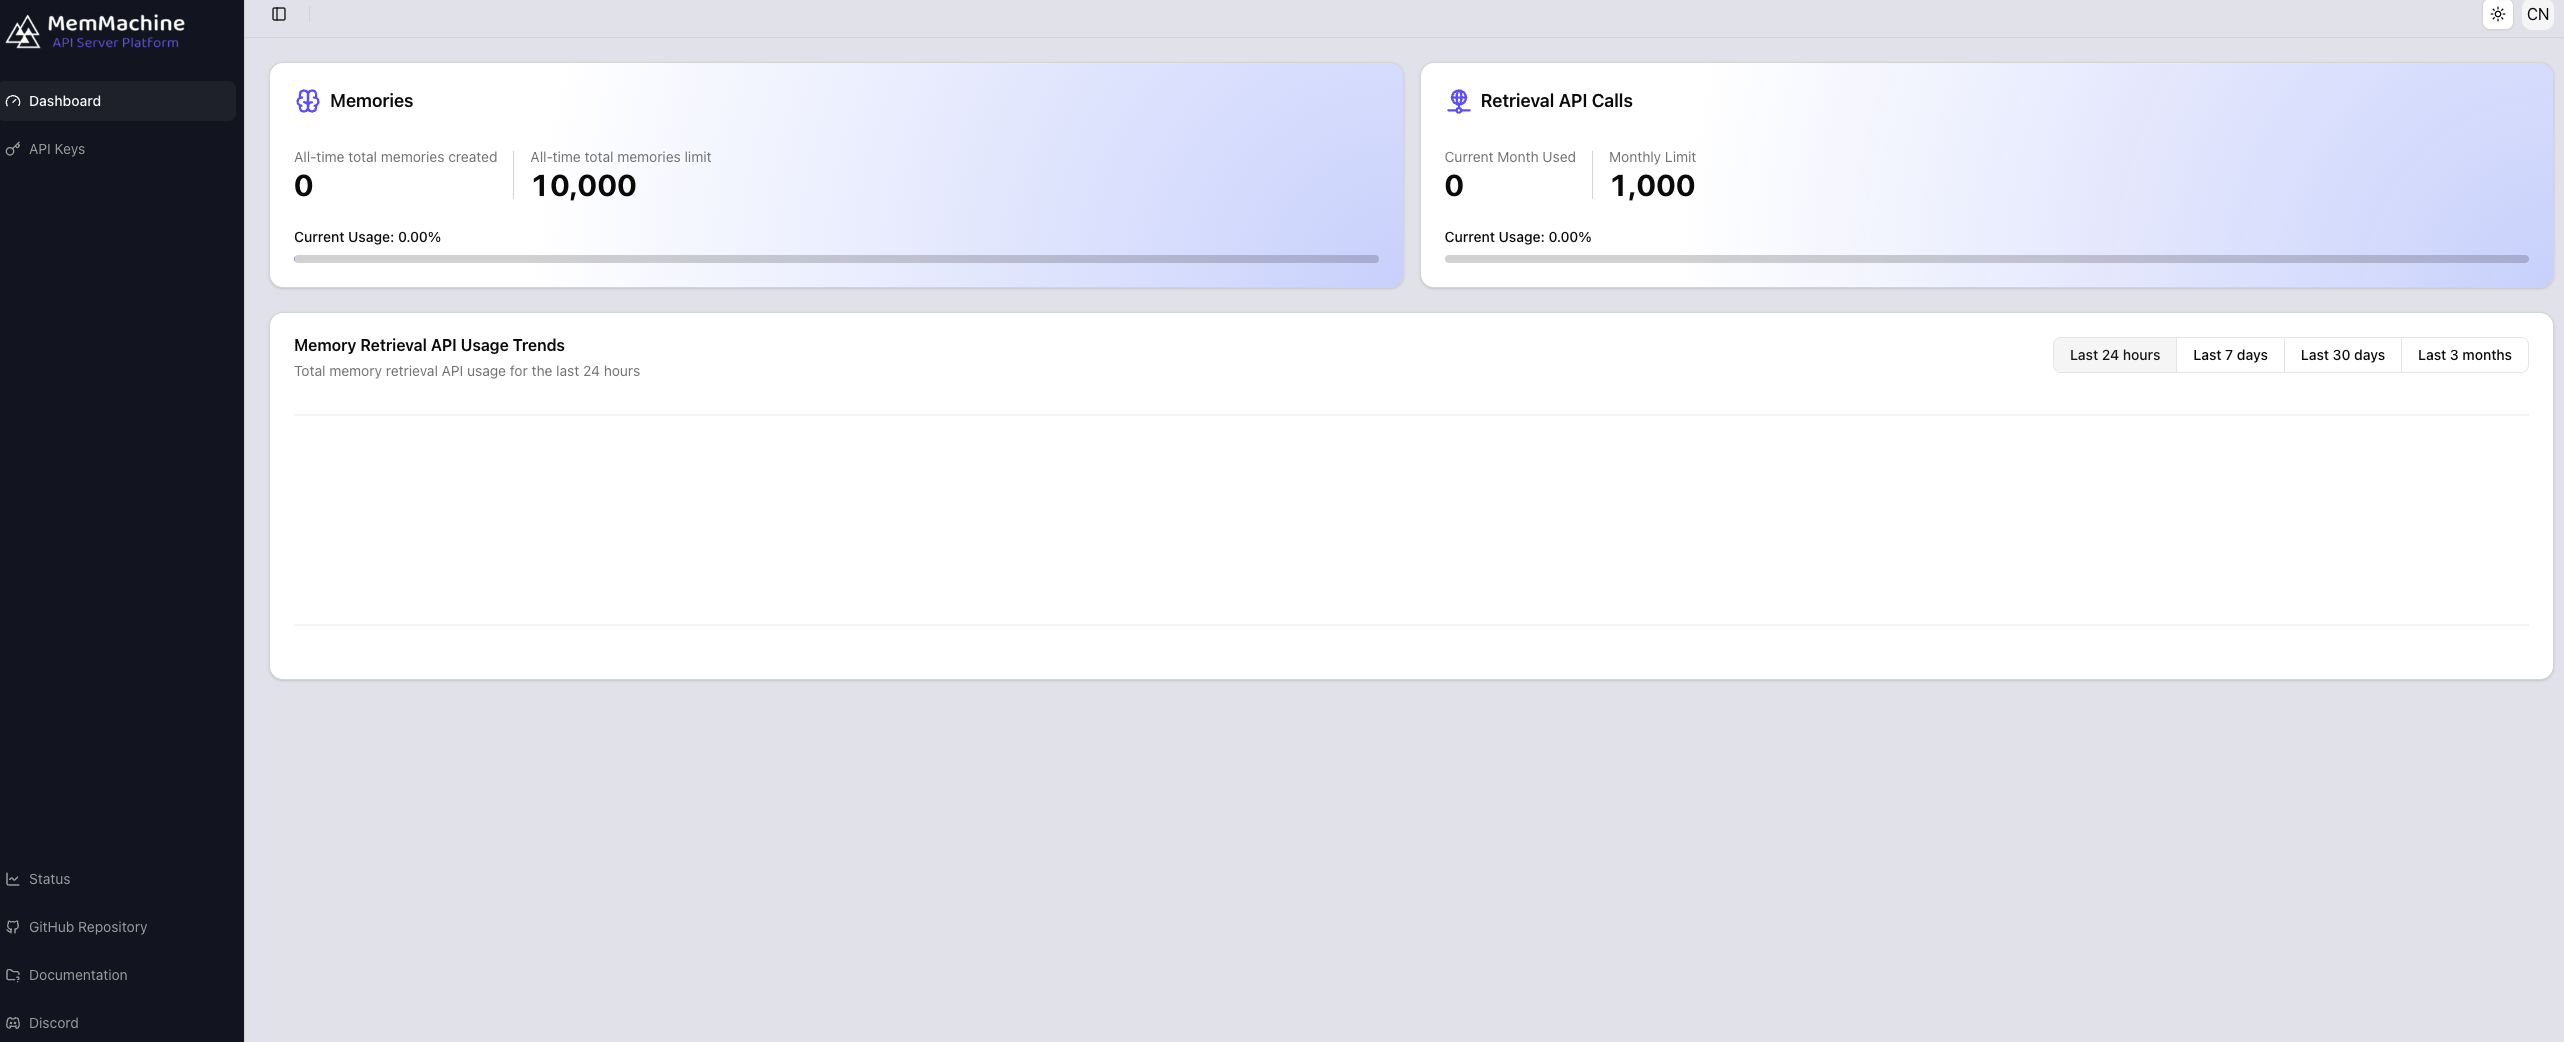
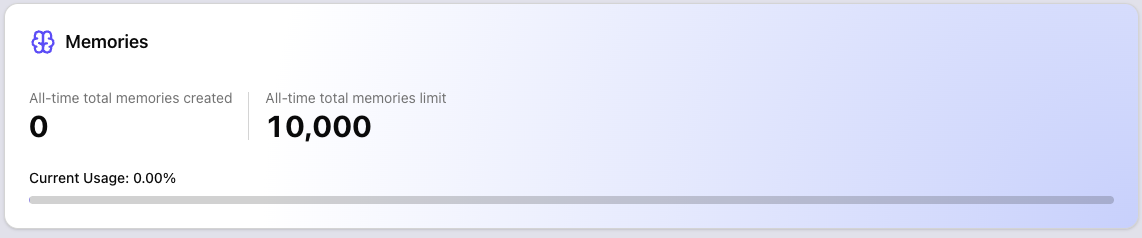
- Memories - the number of Memories you have created, adjacent to the current Memory Limit (10000 memories)
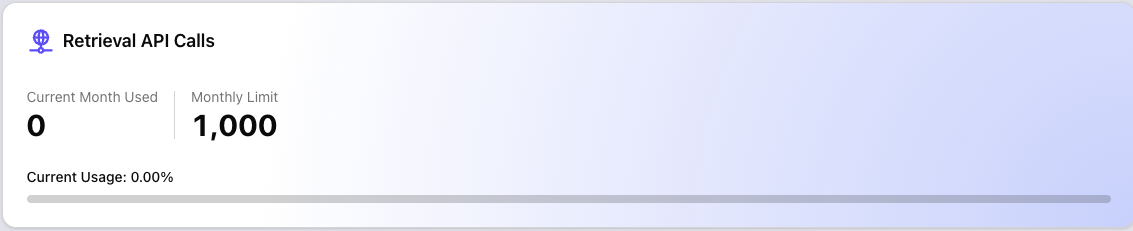
- Retrieval API Calls - the number of API calls you have made, adjacent to the current API Call Limit (1000 memories)
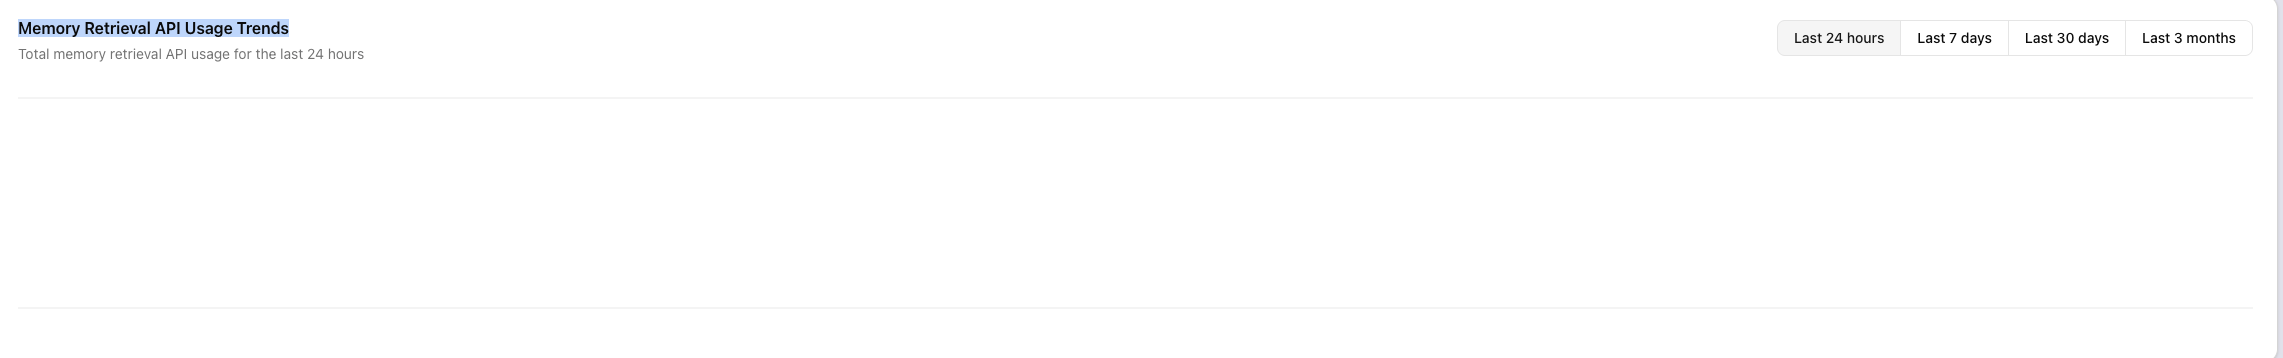
- Memory Retrieval API Usage Trends - Usage trends grouped by the last 24 hours, the last 7 days, last 30 days, and last 3 months
Navigation and Controls
The Platform provides two main navigation areas: the Left-Hand Menu for primary feature access and the Top Menu Bar for account-specific actions.Left-Hand Menu (Primary Features and Links)
Use this menu to quickly navigate between core areas of the Platform:| Link Name | Image | Description |
|---|---|---|
| Dashboard | Returns you to this main overview screen. | |
| API Keys | Where you can create and monitor API Key access and usage. | |
| Status | Links to the MemMachine Status site, showing current and past information on MemMachine Server uptimes and outages. | |
| GitHub Repository | Links to the MemMachine GitHub Repository. | |
| Documentation | Links to the full MemMachine documentation suite. | |
| Discord | Links to the MemMachine Discord Server |
Top Menu Bar (Account and Screen Settings)
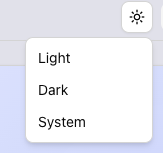
The top-right corner of the dashboard provides quick access to essential account features, detailed below:Screen Settings
Screen Settings

Account and Settings ( CN Icon)
Account and Settings ( CN Icon)